

Hey, donut lovers! We have a sweet treat for you today. We’ve collected the latest donut consumption statistics from around the world, and we can’t wait to share them with you.
Heads up: This is not your average blog post. It’s a deep dive into the world of donuts—and we’re talking about everything from how many donuts are consumed per year in the United States, to how much money is spent on donuts every year. We’ve even included the top flavors of donuts that consumers like to eat and which country eats the most donuts (Hint: It’s not the US).
So what are you waiting for? Sit down and enjoy a sweet treat while you read up on what makes us all so unique when it comes to our favorite pastry!
General Donut Industry Statistics
1. The global donut market was estimated to be worth $15.78 billion in 2021.
It is further expected to reach $19.94 billion by 2028, growing at a CAGR (Compound Annual Growth Rate) of 3.4% between 2021 and 2028.
(Research and Markets)
2. There are around 203.09 million donut consumers in the United States.
The above is the latest estimate for 2021 based on historical data between 2011 and 2020. The number of donut consumers in the United States in 2011 stood at 173.57 million, gradually increasing to 201.02 million in 2020.
The first time the number of donut consumers in the United States exceeded 200 million within the same period was in 2018 when it stood at 200.8 million.
If you’re looking for a sweet treat, there’s no denying that America has you covered: around 10 billion doughnuts are made in the US every year.
(Statista)
3. It is estimated that there will be around 207.31 million donut consumers in the United States in 2024.
Based on historical data on donut consumption in the United States, the forecast number of donut consumers in the United States in 2022 and 2023 stands at 204.51 million and 205.92 million, respectively.
(Statista)
4. The donut store industry market size in the United States is estimated to be worth $7.5 billion in 2022.
The above figure shows a 3.8% increase from the one recorded in 2021. When observing the period between 2017 and 2022, the market size (revenue) of the donut store industry in the United States has been growing at an average CAGR (Compound Annual Growth Rate) of 0.8%.
The industry is highly fragmented and competitive, with intense competition from well-known brands such as Dunkin’ Donuts and Krispy Kreme.
(Ibis World)
5. Donuts account for 35.6% of breakfast bakery product sales in grocery stores in the United States.
The latest data reveals that other sweet goods rank second with 30.6%, followed by muffins and bagels, respectively accounting for 24% and 9.8% of breakfast bakery product sales in grocery stores in the United States.
(Statista)
6. The average price of a donut in a restaurant in the United States stands at $4.92.
In inexpensive eateries, donut prices are as low as $3.96, increasing to $7.24 in moderately expensive restaurants. As expected, donut prices increase to $9.02 in expensive restaurants but, surprisingly, they drop to as low as $5.96 in very expensive eateries.
(Tastewise)
7. 50% of consumers in Poland buy American-style donuts at least once a month.
Another 15% buy this type of donuts at least once a week, while the portion of consumers in Poland who buy American-style donuts once every few months and less than once in three months stands at 17% and 19%, respectively.
48% of consumers in Poland buy traditional, filled donuts at least once a month. Another 17% buy this type of donuts at least once a week, while the portion of consumers in Poland who buy traditional, filled donuts once every few months and less than once in three months stands at 16% and 19%, respectively.
(Statista)
8. Canadians eat more donuts per capita than people in any other country.
The United States may be the home of the donut, but Canada is the king of donuts.
Canadians love their donuts! In fact, Canada is the country with the highest donut consumption per capita.
There are many possible explanations for this, but one thing’s for sure: there’s no shortage of delicious donuts in Canada!
We’re not saying that’s a bad thing. There are plenty of reasons why Canadians love their donuts so much: they’re sweet, fluffy, and delicious. But it does seem like Canadians could cut back on their intake just a bit. Maybe… just try one less donut each week? What do you say 😉?
(CBS News)
Statistics on Donut Consumption Habits
9. 46% of consumers eat donuts once to a few times a month or more.
Another 44% say they indulge in donuts at least once a week or more. When it comes to where they are eaten, 63% of donut consumers say they eat them in their cars and 49% say they eat them at their offices or at parties.
(Brisan Group)
10. Most consumers (87%) buy donuts at national chains.
Town and grocery store bakeries rank as the second and third most popular places to buy donuts, as agreed by 72% and 71% of consumers, respectively.
45% of consumers buy boxed donuts at grocery stores, 38% buy from premium donut shops, and 31% opt for bagged donuts at grocery stores. 12% of consumers buy donuts at restaurants or diners, while 8% make them at home.
(Brisan Group)
11. The age group that consumes the most donuts is 30-49 years.
Have you ever wondered what age group is most likely to eat donuts?
Well, according to a recent study, the age group 30-49 years consumes the most donuts, closely followed by those aged 18-29 years!
Third place goes to 50-64 years old. These folks have been around the block a few times and know what they like: donuts! In fact, many of them grew up eating donuts as children and continue eating them today because they’re delicious and affordable, especially when you’re on a budget.
People in their 30s and 40s eat more donuts than any other age group does, but there’s also some strong competition from younger folks (18-29) when it comes to consuming these tasty treats!
The results are surprising, as one would have expected younger people to be more likely to eat donuts.
It could be that older people have more free time in which they can indulge in eating a donut.
Alternatively, it may be that younger people are more health-conscious and therefore do not eat as many donuts as older people do.
Either way, this is something worth noting if you’re going to be doing any marketing or advertising for your donut store or bakery.
(Statista)
12. The average American consumer eats about 31 donuts every year.
We know you love donuts. We love them too. That’s why we’re so excited to share this statistic:
It is estimated that the average American eats 31 donuts per year, so most Americans eat two to three donuts per month. In fact, more than a third of Americans (37%) eat at least one donut every month—and that’s just the people who admit it!
So whether you prefer your donuts dusted with powdered sugar or smothered in chocolate frosting—or if you’ve made it through life without ever eating a donut consider ordering some delicious donuts for your next party or event.
(Dawn Foods)
13. 13.67% of restaurants in the United States serve donuts.
On average, such restaurants have nine different donut dishes on their menus. Still, in 62% of cases, donuts are sold at designated shops.
(Tastewise)
14. 51% of consumers buy chocolate-frosted donuts a few times or more per month.
Other types of donuts being purchased with the same frequency include glazed (as reported by 47% of consumers), sprinkled (opted for by 40% of consumers), and jelly-filled (as agreed by 30% of consumers).
(Brisan Group)
15. Being a favorite in 15 states, glazed is the most popular donut type in the United States.
The states where glazed donuts shine (pun intended!) are Alabama, Arkansas, Arizona, Colorado, Delaware, Idaho, Illinois, Kansas, Kentucky, Louisiana, Nebraska, New Mexico, Oklahoma, South Carolina, and West Virginia.
Cronuts rank second, being consumer favorites in seven states, i.e. Alaska, Hawaii, Montana, North Dakota, New York, South Dakota, and Vermont.
Apple fritters and donut holes share the third place, as favorites in three states each. Apple fritters are the favorite type of donut in Connecticut, Oregon, and Washington, while donut holes are most loved in Iowa, Maine, and Mississippi.
Blueberry donuts are consumers’ favorites in Indiana and Ohio, while Missourians and consumers in North Carolina are mostly after cinnamon twists. Consumers in the District of Columbia and Rhode Island mostly opt for crullers, while chocolate-glazed donuts are the most preferred ones in Georgia and Tennessee.
Old fashioned donuts are consumer favorites in Minnesota and Nevada, while consumers in Michigan and Wyoming are mostly after paczki. Consumers in Pennsylvania and Texas mostly opt for powdered donuts, while sugar-covered donuts are a favorite in Utah and Virginia.
Apple cider, bear claw, and jelly donuts are consumers’ favorites in New Hampshire, California, and New Jersey, respectively. Floridians mostly opt for bavarian cream donuts, while Boston cream ones are a favorite in Maryland. Chocolate frosted donuts are consumers’ favorite in Massachusetts, while Wisconsinites are mostly after long john donuts.
(The Waycroft)
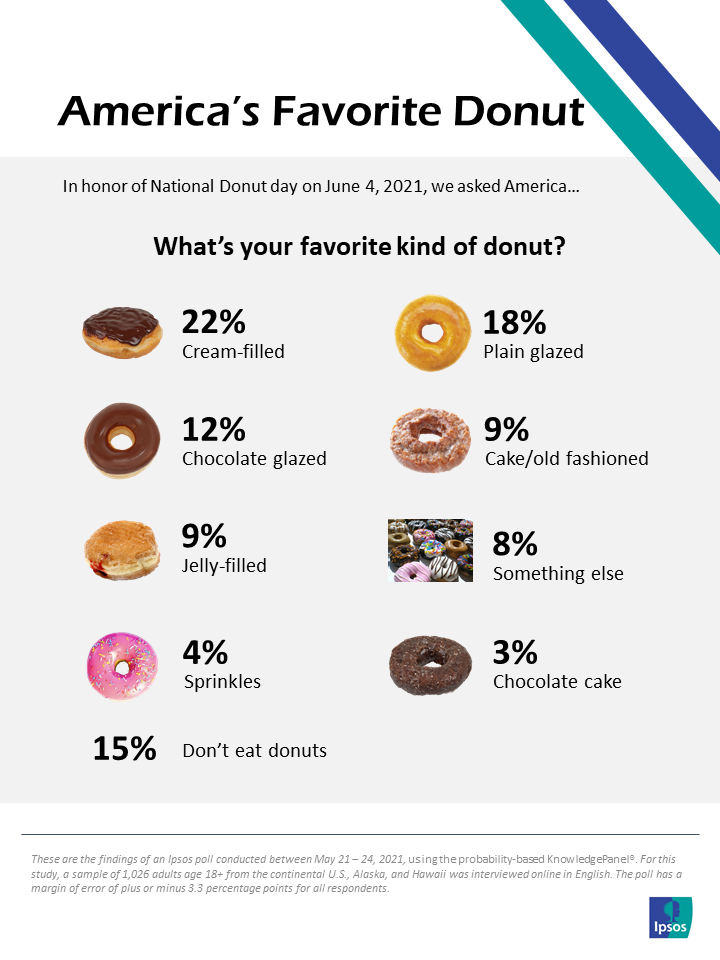
16. Cream-filled donuts are the most popular kind of donuts in America.
According to data from a recent poll, Americans love all things donuts. Cream-filled donuts (22%) have long been a favorite, but they’re not alone: plain glazed (18%), chocolate glazed (12%), plain cake, and jelly-filled (9% each ) are also popular favorites.
So what are you waiting for? Order yourself a box of cream-filled donuts today and get ready to celebrate!
(Ipsos)
17. Most consumers (90%) buy donuts to treat themselves.
The second most popular reason for buying donuts is their taste, as agreed by 70% of consumers. 57% get them for breakfast, 55% buy them as a treat for family and/or friends, while 48% get them as a snack.
39% of consumers say they buy donuts because they’re easy to take to an event or party and 37% get them as dessert. 36% of consumers buy donuts because they’re convenient and 31% do so because they’re nostalgic.
16% of consumers agree they buy donuts because of their price, 12% say they do so because they make no mess, while 10% of consumers say they buy donuts out of habit.
(Brisan Group)
18. 77% of consumers are interested in healthier donut alternatives.
With healthier alternatives being donuts low in sugar, carbs, and fat, with no high-fructose corn syrup, and enriched with protein and fiber, 72% of consumers agree they should taste the same as donuts they would typically buy.
31% of consumers say that, if available, they would purchase healthier donut alternatives, while another 32% could see themselves eating more donuts than they do now.
When it comes to the reasons why consumers would purchase healthier donut alternatives, 82% would buy them because they taste similar to donuts they typically buy but are better for them, while 71% put still feeling like they’re indulging as the main reason.
(Brisan Group)
19. Bulk or 1-count donuts account for 36.4% of the total donuts sales in the United States.
6-count donuts are the second most popular at 18.5%, followed by 12-count and donut holes or mini donuts, respectively accounting for 16.8% and 16.1% of donut sales.
At only 3.9%, 2- to 5-count donuts are the least popular, while all other types account for 8.5% of the total donuts sales in the United States.
(Statista)
20. Donuts are paired with coffee in 39.53% of cases.
Other beverages that consumers typically order along with donuts include ciders (26.15%), tea (10.08%), and beer (7.77%).
(Tastewise)
21. Krispy Kreme glazed donuts are one of America’s top break-up foods.
(Yelp EAT24)
Have you ever had a Krispy Kreme glazed donut when you were feeling a little down in the dumps?
Well, it turns out that’s not an uncommon occurrence. In fact, according to a study by Yelp, Krispy Kreme glazed donuts are a favorite of America’s heartbroken, along with other classic treats like ice cream, pizza, and cake.
So if you’re looking for a way to get over your ex and feel better about yourself, we recommend treating yourself to some delicious Krispy Kreme donuts!
Statistics on Donut Manufacturers and Vendors
22. In the United States, there are 18,010 donut shops.
It’s no wonder Americans love their donuts—they’re delicious, they’re fun to eat.
But one of the most interesting facts about donuts is their sheer ubiquity. In the U.S., there are 18,010 donut shops. That’s a lot of donuts!
Donuts come in all shapes, sizes, and flavors—and they’re made from many different ingredients. Some are deep-fried while others are baked; some use cake batter while others use yeast dough; some are glazed with chocolate or frosting while others have sprinkles or nuts on top; some are filled with cream cheese or jelly while others have fresh fruit inside them (like apples).
You can find donuts at local bakeries as well as grocery stores throughout America’s neighborhoods—and even on the side of roadways when they’re sold by street vendors!
(NPD)
23. With over 63.83 million consumers, Dunkin’ Donuts is the most-eaten brand of donuts in the United States.
Krispy Kreme and Store Brand rank second and third with 46.36 million and 46.07 million consumers, respectively. Hostess, Entenmann’s, and Little Debbie follow with respective 33.74 million, 27 million, and 24.33 million consumers in the United States.
With respective 5.89 million and 5.84 million consumers, Tastykake and Dolly Madison round the list of most-eaten donut brands in the United States, while 39.84 million consumers opt for other brands.
(Statista)
24. Dunkin’ Brands is the leading producer in the donut industry in the United States.
As per the latest available data, Dunkin’ Brands accounts for 15.16% of the total revenue generated by the donut industry in the United States.
The list of the top producers is rounded by Krispy Kreme and Tim Horton’s, which account for respective 4.65% and 4.43% of the total donut industry revenue in the United States.
(News Channel Nebraska)
25. There are 9,421 Dunkin’ Donuts establishments in the United States.
The states with the highest number of Dunkin’ Donuts establishments are New York, Massachusetts, and Florida. There are 1,430 Dunkin’ Donuts establishments in New York, accounting for 15% of the US total, which also means a location for every 13,604 people in the state.
Accounting for 11% of the total number of Dunkin’ Donuts establishments, Massachusetts has 1,089 of them, or a location for every 6,329 people in the state.
Florida has 888 Dunkin’ Donuts establishments, or one for every 24,186 people in the state, accounting for 9% of the total number of Dunkin’ Donuts establishments in the United States.
(ScrapeHero)
26. 11 US States and Territories don’t have a single Dunkin’ Donuts location.
The list of US States and Territories with no Dunkin’ Donuts establishments includes: American Samoa, Guam, Idaho, Montana, North Dakota, Northern Mariana Islands, Oregon, Puerto Rico, South Dakota, U.S. Virgin Islands, and Washington.
(ScrapeHero)
27. With 212 of them, Chicago is the city with the highest number of Dunkin’ Donuts establishments in the United States.
The list of cities in the United States that have more than a hundred Dunkin’ Donuts establishments is rounded by New York, Brooklyn, and Philadelphia, with 166, 138, and 131 establishments, respectively.
The list of the top ten cities by number of Dunkin’ Donuts establishments goes on with Bronx (91), Boston (58), Orlando and Fort Lauderdale (50 each), Miami (41), and Staten Island (39).
(ScrapeHero)
28. Private label vendors sold $524.9 million worth of donuts in the United States in 2021.
The second and third places were taken by Hostess Brands and Grupo Bimbo, who generated $451.8 million and $389 million in donut sales revenue. Jab Holding Joh a Benckiser, McKee Foods, and Flowers Foods round the list of vendors making over $100 million in donut sales revenue, generating $245.3 million, $234 million, and $104.3 million, respectively.
The list of the top 10 vendors making the most in donut sales in the United States is rounded by Clydes Delicious ($29.6 million), United States Bakery ($28.3 million), Bon Appetit Danish ($24.2 million), and Carolina Foods ($14.4 million).
(Statista)
Conclusion
That’s a lot of data and an even bigger takeaway: donut consumption is on a steady rise. We expect them to continue to grow in popularity as they become more and more available at all times of the day (and why not?).
If you have any questions about these statistics or anything else donut-related, please feel free to reach out! We’d love to hear from you!
In the end, donuts are a treat. They’re meant to be enjoyed and enjoyed often! So what are you waiting for? Go out and get yourself a donut today—maybe even two!
Thanks for reading!
465 Donut Shop Name Ideas That Will Make You Hungry
160+ Memorable Donut Shop Slogans and Taglines
859 Dessert Business Name Ideas That Are Too Cute to Pass
While this article does a wonderful job describing the supply side of the donut industry and it’s growth, it would be good to know some basic pricing date. For example, what has been the average annual price of a glazed donut over the past 25-50 years? Are retail donut prices a good measure of inflation?