
A mortgage is a loan given out by a mortgage lender or a bank to acquire a property. The mortgage industry is complex and opaque. This industry caused the housing market bubble to burst, which led to a global financial meltdown.
Moving on, a very pressing issue in the United States of America over the years has been racial profiling, segregation, and discrimination. Discrimination in the mortgage market is something that wasn’t visible to the naked eye all these years. Mortgage Discrimination is the practice by mortgage lenders, banks, the government, and other lending institutions denying loans to a person or a group of people based on their race, sex, religion, or ethnicity.
The issue of mortgage discrimination came into the limelight not until 2018. Academic institutions and public policy think tanks have since studied mortgage discrimination indiscriminately. This offers explanations for why you might get denied a loan or charged a higher interest rate when buying a home.
Here are some key statistics that shed light on mortgage discrimination:
- Black and Hispanics pay up to 7.9, basis points more on home purchase mortgages.
- The Black and Hispanic community is 40-80% more likely to be rejected than their white counterpart.
- The share of loan applications from Black and Hispanic ethnicities has reduced by 6-7% over a decade.
- Asians and Pacific Islanders have the highest average credit score and higher average property value yet face higher denial rates than their White counterparts.
- The LGBTQ+ loans are ~8% less likely to be approved and pay ~0.2% higher interest rates than their heterosexual counterparts.
- Women default less than men yet pay 8-13 basis points higher in interest rate than men.
- While fintech platforms discriminate 40% lesser when pricing the loans, Minority borrowers on average pay 5.3 basis points more on home purchase mortgages on fintech platforms.
Mortgage Discrimination Statistics
The Consumer Financial Protection Bureau (CFPB) has made immense progress in tracking racial mortgage discrimination in the United States.
Here are some statistics that give a preview of the mortgage discrimination in the United States:
1. Black and Hispanic ethnicities have the lowest homeownership rate in the United States, around 17-22% less than the overall rate.
According to a 2017 Urban Institute report, Non-Hispanic White ethnicities had a homeownership rate of around 72%, the highest in the country for any ethnicity.
In 2017, the overall homeownership rate in the US was 63.9% against Black and Hispanic ethnicities, with a homeownership rate of 41.8% and 47.3%, respectively.
Much of the low homeownership rate among minorities is attributed to lending disparities, residential segregation, and mortgage discrimination.
2. Black and Hispanic communities pay nearly 7.9 basis points more on home purchase mortgages.
According to a UC Berkely research paper, Hispanic and African-American borrowers pay nearly 7.9 and 3.6 basis points more in interest for home purchase and refinance mortgages.
The higher interest rates could be in the light of low credit scores, lower average income, and higher debt to income ratio than other ethnicities.
According to the same report, mortgage discrimination currently costs Black and Latino borrowers $765 million in extra interest per year. Higher interest rates lead to higher loan costs.
Black and Hispanic communities continue to pay the highest interest rates despite having lower average property value and average loan amount. Around 45-50% continue to reside in minority neighborhoods.
According to a CFPB report, Black and Hispanic borrowers paid an average interest rate of 3.33% on loans among all other minorities.
These ethnicities had the smallest share among borrowers who availed of Jumbo loans. Asian and Pacific Islander ethnicities paid the least interest, around 3.11%, despite having the largest share, about 10%, availing Jumbo loans.
3. Black and Hispanic communities are 40-80% more likely to be denied a loan than their White
The Black and Hispanic communities faced the highest mortgage denial rate amongst all ethnicities. Non-Hispanic White ethnicity had the highest acceptance rate among all other races. Loan applicants of color were 40%–80% more likely to be denied than their White counterparts.
According to CFPB, in 2020, the denial rate for Asian and Pacific Islanders was 10% compared to 7% for Non-Hispanic White, 12% for Hispanic White and 18% for African-American ethnicities. While the denial rates within minority ethnicities might have reduced over the years, it is not entirely a result of less discrimination.
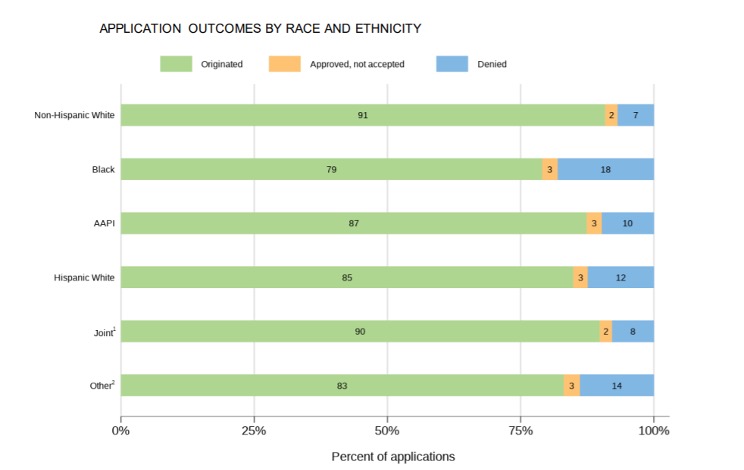
Source: CFPB
A 2015 Pew Research report shows the deepening bias in loan applications. Loan applications from Black ethnicities fell from 10% to 4% between 2005 and 2015, and that of Hispanic ethnicities fell from 14% to 7% in the same period.
According to the same report, application volume for conventional mortgages fell 69% overall between 2005 and 2015, but the drop was 88% for African-Americans and 85% among Hispanics, 66% for whites, and 57% for Asians.
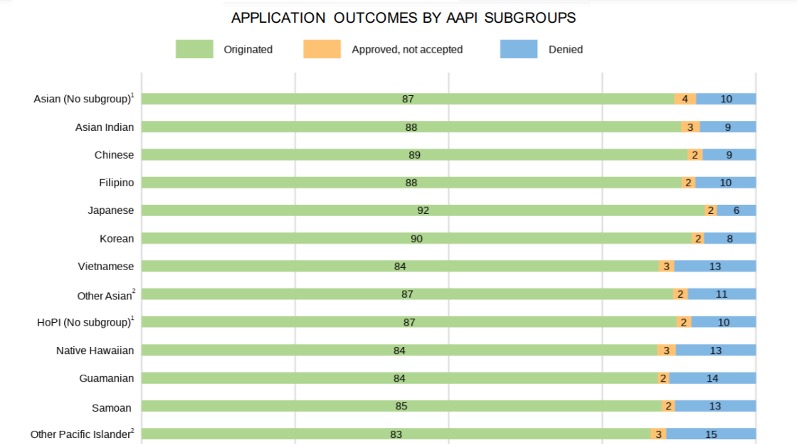
5. Asians and Pacific Islanders have the highest average credit score, and higher income levels yet face higher denial rates than their white counterparts.
Asian and Pacific Islanders had higher denial rates than Non-Hispanic White communities. This is the case despite the Asian ethnicities having the highest average credit scores, highest income levels, and highest property values among all other ethnicities. This proves that despite being projected as a ‘model minority, Asians continue to face discrimination by mortgage lenders.
The denial rate for a few of the Asian and Pacific Islander sub-groups was high and comparable to that of the Black and Hispanic groups. On the other hand, the denial rate for certain Asian sub-groups like Korean and Japanese was pretty low and comparable to those of Non-Hispanic White counterparts. This means that one cannot generalize the discrimination against Asian and Pacific islanders groups.
The discrimination varies with country of origin. Asians and Pacific Islanders are also much more likely to live in minority and lower-income neighborhoods than their Non-Hispanic white counterparts.
Black and Hispanic ethnicities are most likely to live in minority and lower-income neighborhoods. 15% of all Asian and Pacific Islander borrowers, 28% of all Black and Hispanic borrowers, and 13 % of all Non-Hispanic borrowers lived in Lower Median Income(LMI) tracts.
Nearly 35% of all Asian and Pacific Islander borrowers and 45-50% of Black and Hispanic borrowers lived in minority neighborhoods as against only 9% Non-Hispanic White borrowers.
Source: CFPB
6. Nearly 86% of Asians and Pacific Islander borrowers apply for conventional loans, While 61% of Black borrowers prefer non-conventional loans.
Asians and Pacific Islanders were most likely to apply for conventional loans than any other ethnicity. Black and Hispanic ethnicities were more likely to use non-conventional loans like Federal Housing Administration(FHA) or Veterans Administration(VA) loans compared to any other racial group.
A conventional loan is availed at a bank or a financial institution at lesser interest rates than a non-conventional loan. Conventional loans are generally more secure available to borrowers with a good credit history and higher income levels. On the other hand, a non-conventional loan is availed at a higher interest rate, generally insured by the government. It caters to borrowers with lower credit scores or income levels.
Asians and Pacific Islanders were more likely to borrow from conventional sources due to higher income levels, better credit scores, and collateral availability. On the other hand, Black and Hispanic ethnicities.
7. Around 70% of Asians and Pacific Islanders applied for mortgage refinancing versus 66% for White, 52% for Black, and 53% for Hispanic communities.
Borrowers tend to refinance their loans to avail of lower interest rates, alter payment schedules or get suitable loan terms. According to CFPB, the Asians and Pacific Islander ethnicities refinanced their loans more than any other ethnicity, whereas Black and Hispanic communities were least likely to.
In all, around 70% of Asians and Pacific Islanders refinanced their loans compared to Non-Hispanic White at 66%, Black and Hispanic communities at 52% and 53%, respectively. This could possibly explain why the former pay lower interest rates and have better characteristics than others in the mortgage market.
8. Black and Hispanic communities had the lowest average property value among all other ethnic groups.
According to CFPB, Black borrowers have the lowest average property value as compared to other ethnicities, whereas Asians and Pacific Islanders have the highest average property value.
Black and Hispanic ethnicities have an average property value of $281,125 and $300,718, respectively, whereas Asian and Pacific Islander minorities have an average property value of $555,681.
Despite the gap, Black and Hispanic borrowers have the highest average loan cost among all other ethnicities.
9. Black and Hispanic communities pay nearly $1300-1800 more on average in loan costs than their White counterparts
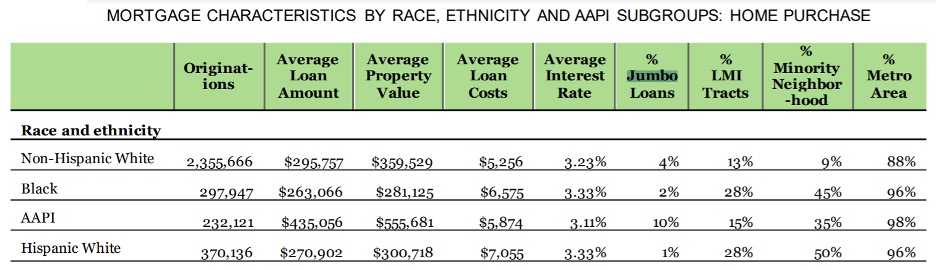
Black and Hispanic communities had a higher average loan cost than all other communities despite having the lowest average property value and lower average loan amounts.
While Black and Hispanic communities had an average loan cost of $5,256, the Non-Hispanic White and Asian communities had an average loan cost of $5,265 and $5,974, respectively.
10. Minorities and the elderly are more likely to apply for Chattel or Manufactured Housing(MH) loans than site-built loans, nearly 65-80% get rejected.
Chattel Mortgages(CM) are given out for buying manufactured homes or movable property items. Loans on Chattel and Manufactured Housing(MH) loans have higher interest rates and lower property values.
Unlike mortgages on site-built homes, the lender takes ownership of manufactured homes and handover ownership only after the complete amount is paid back.
According to a May 2020 report by CFPB, the African-American ethnicity was most likely to apply for a Chattel or Manufactured Housing mortgage than any other community, and the Asian and Pacific Islander community was least likely to. The fact remains that only 20.5% of Chattel loans and 35.2% of Manufactured Housing loans get originated/accepted.
11. The LGBTQ+ loans are ~8% less likely to be approved and pay ~0.2% higher interest rates than their heterosexual counterparts.
A 2019 report by the National Academy of Sciences gives insight into the data reveals that, compared with otherwise similar different-sex applicants, same-sex applicants are 73.12% more likely to be denied, and they tend to be charged up to 0.2% higher fees/interest. The discrimination costs the community up to $86 million annually in additional interest/fees nationwide.
According to a study 2019 study at the University of Alabama, a same-sex male applicant is significantly less likely to be approved than a white heterosexual applicant. Lesbians fared better where their approvals rates were indistinguishable from White heterosexual couples.
Check out 36 LGBT Discrimination Statistics To Leave You Speechless
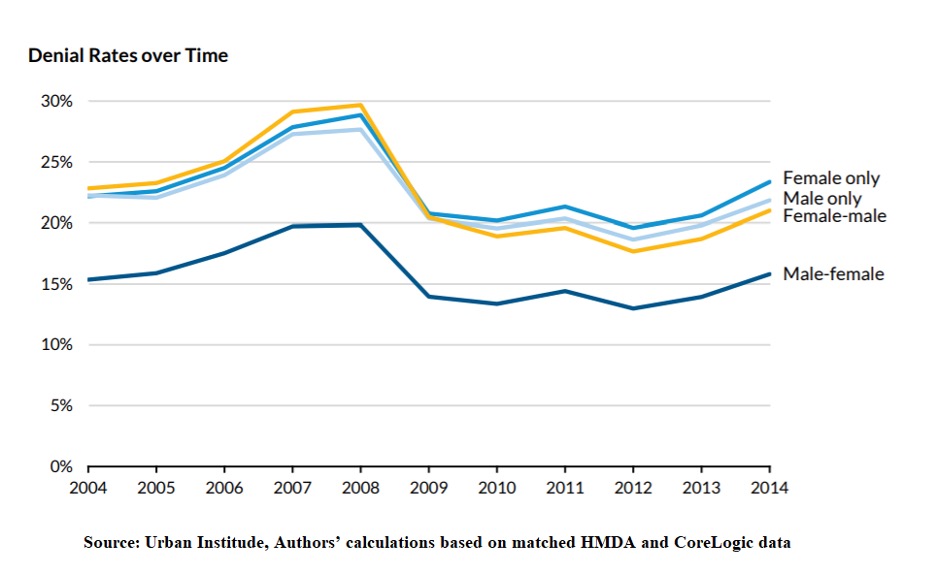
12. Women default less than men yet pay 8-13 basis points higher in interest rate than men.
According to a research report by Urban Institute, female-only borrowers default less than male-only borrowers yet have comparably higher denial rates than male-only borrowers. Women pay 8-13 basis points higher in interest rate than men.
Female-only borrowers paid an average interest rate of 5.48% compared to 5.41% for male borrowers between 2004 to 2014. On the other hand, we notice that joint mixed-gender borrowers were more likely to get approval, especially when the primary borrower is a male.
13. Total loan cost for home purchases is 4.7% higher for Lower-to-Moderate Income neighborhoods over High-Income neighborhoods.
According to an August 2020 CFPB report, The median total loan costs of home-purchase loans were higher for loans secured by properties in Low-to-Moderate Income(LMI) neighborhoods than those in middle-income or high-income neighborhoods.
Total loan cost for home purchases is ~4.7% higher for LMI neighborhoods over High-Income neighborhoods., while the total loan cost for refinancing was around ~5% more for LMI neighborhoods over High-Income neighborhoods.
The total loan cost of home purchase loans was $4,859 for LMI neighborhoods, $4,790 for middle-income neighborhoods, and $4,637 for high-income neighborhoods. The scenario was similar for refinancing loans, where the total loans cost were more for LMI neighborhoods ($3,443) than the middle($3,319) or high-income neighborhoods($3,272).
14. Milwaukee, St. Louis, and Cleveland have racial disparity in denial rates for mortgage purchase loans. Sacramento, Seattle, and San Diego have the lowest.
According to LendingTree, Milwaukee, St. Louis, and Cleveland largest spread between the denial rate for Black homebuyers and the overall denial rate for mortgage purchase loans.
The average spread for these metros was 10.96%. On the other hand, Sacramento, Seattle, and San Deigo has the smallest spread between the denial rate for Black homebuyers and the overall denial rate for mortgage purchase loans. The average spread for these metros was 3.45%.
On the above lines, Phoenix, Philadelphia, and Denver topped the chart in terms of racial disparity in denial rates for refinancing loans, where the average spread stood at 21.93%. On the other hand, Dallas, Minneapolis, and Miami had the smallest refinance denial rate spread where the average spread stood at 4.4%.
15. While fintech platforms discriminate 40% lesser when pricing the loans, Minority borrowers on average pay 5.3 basis points more on home purchase mortgages on fintech platforms
According to a research report by UC Berkely, minority borrowers on average pay 5.3 basis points more for home purchases and 2.0 basis points for refinancing mortgages originated on fintech platforms.
The gap increases for in-person borrowings, where they pay an average of 7.9 basis points on home purchases and 3.6 basis points for refinancing. While fintech platforms did not discriminate while accepting or rejecting loans, they discriminated 40% less while pricing the loans.
Conclusion
Mortgage discrimination is a serious problem in the United States. It contributes to racial segregation and can affect health outcomes and life expectancy in minority groups.
When people think about mortgage discrimination, they tend to think about “redlining” and other blatant things like that. This is definitely still a problem, but it’s not the only way people can be discriminated against when it comes to the mortgage industry. Keep an eye out for these facts when you’re looking into how to apply for a mortgage—they may be more prevalent than you think!
Mortgage lenders could take steps to reduce the prevalence of mortgage discrimination. These steps include implementing policies to eliminate implicit bias and training employees on how to be aware of this bias.
There are a few takeaways from this blog post, but the main one is that the mortgage industry has a long way to go in terms of fair practices, and we need to keep fighting for change until the day discrimination is eradicated.
As always, if you have any comments or questions, please feel free to drop us a line anytime.
How Does Better Mortgage Make Money? (Business Model)