

Soda is a controversial topic. Some people are addicted to it. Others believe it’s causing everyone in the world to turn into styrofoam. But before you make up your mind, check out these soda consumption statistics from around the globe. You may be surprised by what you find!
Soda is so weird.
I mean, think about it: there’s this carbonated syrup with a bunch of chemicals in it that we just suck down like it’s water.
I’m not gonna lie, I love soda—but I have to say, many of the statistics I looked at made me feel pretty icky about my favorite beverage.
Here are the latest soda consumption statistics to make you feel gross about drinking soda (or maybe reaffirm your love of it).
Soda Consumption Statistics (Editor’s Picks)
- 48% of American adults drink at least one glass of soda every day.
- 52% of Americans claim they don’t normally drink soda.
- 52% of men in the US drink soda regularly.
- More than half of American adults aged 30 to 49 regularly drink soda.
- More American adults drink regular soda than diet soda.
- In 2019, Mexico had the highest soda consumption by country.
How Often Do Americans Drink Soda?
1. 52% of Americans claim they don’t normally drink soda.
(Gallup)
Although it’s just two percentage points above the 50% mark, it’s still indicative that more Americans avoid soda than those who regularly drink it. Further statistics show that men, White people, and adults aged 55 and above normally don’t drink soda.
2. 48% of American adults drink at least one glass of soda every day.
(Gallup)
Looking further into this statistic, we’ll see that 28% of those who do drink soda drink at least one glass per day on average. Additionally, 9% drink two glasses on average, 4% drink three glasses, and 7% drink four or more glasses of soda per day on average.
3. Americans consume a daily average of 2.6 glasses of soda.
(Gallup)
Considering the advice of health experts that even one glass of soda is too much soda, this average number can be worrying. Luckily, more than half of Americans don’t normally drink soda.
Additionally, more and more Americans are putting down soda cans since they’re becoming more aware of the health effects that come as a result of regular soda consumption.
4. Soda consumption in the United States reached 40.4 gallons per person in 2021.
(IBISWorld)
For the 15th year in a row, soda consumption in the country has declined. Since 2006, when 45.8 gallons of soda were consumed per person, total consumption declined by 11% in 2021.
Although the US still has one of the highest soda consumption rates globally, more people are becoming aware of the health effects of drinking soda on a regular basis, thereby causing this decline that we’ve been seeing for 15 years now.
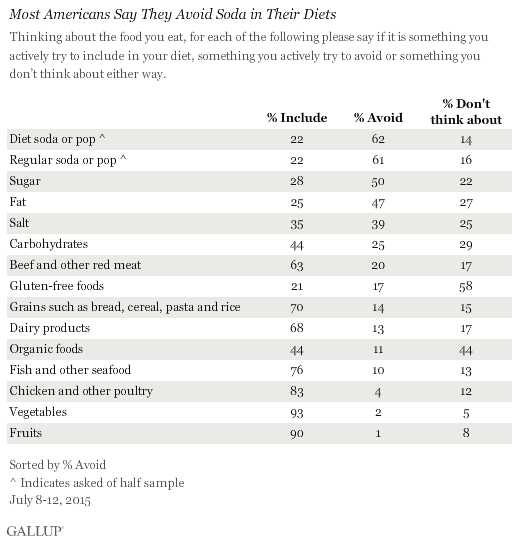
5. 62% of U.S. adults are trying to avoid sodas of any kind, diet or regular.
(Gallup)
Forget diet versus regular soda. U.S. adults have something much bigger in mind – staying away entirely.
If you want to live a healthy life, you need to be vigilant in your pursuit of health. Though many of us are aware that we need to make healthier choices, most of us look to quick fixes and short-term solutions rather than long-lasting, sustainable improvements.
That’s why it is so refreshing to see reports like the one from Gallup that show that more adults are choosing not to drink soda. The number of adults in the U.S. who are trying to avoid soft drinks has been steadily increasing over the last decade, and now it’s at a whopping 62 percent.
It’s this kind of commitment to life-long health that is going to make the biggest difference in our national wellbeing!
But what has American consumers doing an about-face? According to Gallup, it’s likely because more Americans than ever before now view obesity as a serious health problem in the U.S., which may be why they’re making a concerted effort to cut added sugar out of their diets or just trying to avoid artificial sweeteners.
A majority of doctors agree that a can or two of soda isn’t going to harm your health—but most also recommend that you choose lower-calorie and natural beverages, such as skim milk or water, if you’re looking for something to wash down your meal.
Who Drinks the Most Soda?
6. 58% of individuals between the ages of 30 and 49 regularly consume soda.
(Statista)
It’s pretty mind-boggling, but recent data show that the older population has more regular soda drinkers than younger people.
People in their 30s and 40s typically drink more regular soda than people in other age groups. Those aged 50 to 64 come second, but they don’t fall far behind, with 57% of the individuals in the age bracket being regular soda drinkers.
Lastly, 49% of adults in the 18–29 age bracket regularly consume soda.
7. 52% of men in the US drink soda regularly.
(Gallup)
Soda: the great American beverage.
But is it more popular with men, or with women?
Several surveys have shown that men are generally more likely to be regular drinkers of sugary drinks than women—including soda. Statistics show that while 52% of men regularly drink soda, 43% of women report the same.
While this might seem like an insignificant difference, it’s actually a pretty major one—the soda industry relies on the fact that almost everyone drinks their product, and losing even a few percentage points can mean big losses in revenue.
Not only that, but the soda industry has historically had a negative impact on our public health, so any loss in revenue could be a win for us as a society. Soda companies have contributed to the decline in people’s health by making it easy to overconsume sugar (which contributes to obesity and diabetes) and by adding artificial ingredients that can cause cancer.
Additionally, since soda companies tend to market primarily to young people and children, they are inflicting harm on those who are most vulnerable to their tactics.
8. 53% of non-white Americans consume soda regularly.
(Gallup)
When it comes to race and ethnicity, studies have shown that white people drink less soda than people of other ethnicities. This applies to middle school children, high school students, adults, and basically individuals of all ages.
Soda Preference: Regular Soda Versus Diet Soda
9. More American adults drink regular soda than diet soda.
(Gallup)
According to a survey conducted by Gallup involving 2,027 adults aged 18 and older in the US, 32% prefer regular soda, while 24% prefer diet soda. However, 43% don’t drink soda at all.
The main reason why people choose regular soda is that it tastes good without the aftertaste that is usually found in diet sodas. You’re drinking soda anyway—might as well get the good stuff!
10. Men are more likely than women to reach for a regular soda drink.
(Gallup)
When it comes to gender, men have a higher preference for regular soda than diet soda. In particular, 36% of the male population in the US prefer regular soda, while 23% drink diet soda. On the other hand, only 28% of women in the US drink regular soda regularly.
11. White Americans slightly prefer diet soda, while non-whites prefer regular soda.
(Gallup)
While there is only a small gap in the percentage of white people who drink regular soda versus diet soda, a huge gap exists in the same percentages among non-white people in the US.
For example, 29% of white people prefer diet soda, while 27% regularly drink regular soda. On the other hand, among the non-white population, 46% love regular soda, while only 13% prefer diet soda.
12. Adults between the ages of 18 and 29 have the highest percentage of regular soda drinkers.
(Gallup)
In particular, 50% of those in this age bracket are regular drinkers of regular soda, while only 13% prefer diet soda.
As people age, particularly as they reach the 30 to 49 age bracket, the gap starts to narrow down. At this point, only 32% prefer regular soda, while 23% now drink diet soda regularly.
Ultimately, when they enter the 50 to 64 age group, they’re more likely to prefer diet soda (28%) over regular soda (25%)
13. Adults aged 65 and above prefer diet soda the most among different age groups.
(Gallup)
The relationship between the consumption of regular soda and age is inversely proportional. This means that as people age, they tend to prefer diet soda over regular soda, which is probably because we are inclined to be more health-conscious as we age.
Hitting the age of 50 is when people start to prefer diet soda over regular soda. By the time people reach the age of 65, 32% of them prefer diet soda, while 22% will still reach for a regular soda regularly.
14. Low-income individuals mostly drink regular soda, while high-income people choose diet soda most of the time.
(Gallup)
According to a Gallup survey, 45% of people who earn less than $30,000 per year mostly drink regular soda as opposed to only 20% who choose diet soda most of the time.
On the other hand, 30% of those with an annual income of $75,000 or more prefer diet soda as opposed to only 20% who love regular soda.
15. Overweight individuals prefer diet soda more than those with ideal weights.
(Gallup)
Looking at the statistics of America’s soda drinking habits by weight, 32% of overweight individuals say that they mostly drink diet soda, while only 19% of individuals with a normal weight report the same.
When it comes to regular soda, both groups have the same percentage of regular and diet soda drinkers—31%.
Global Soda Consumption Statistics
16. In Australia, 12% of men consume sugary drinks, including soda, on a daily basis.
(Australian Bureau of Statistics)
In this country, men are more likely to drink sugary drinks than women. This includes regular and diet soda. Statistics show that while 12% of men consume sugary drinks on a daily basis, only 6% of women report the same. Men are also more inclined to consume more diet drinks.
17. In 2019, Mexico had the highest soda consumption by country.
(Statista)
Among the 10 most populated countries in the world, Mexico held the top spot for most soda consumption, with an average of 630 8-ounce servings per person per year. This change in dietary patterns in Mexico contributed to the prevalence of diabetes among its population.
Experts believe that with the current rate, diabetes may affect anywhere from 13.7% and 22.5% of Mexican adults by 2050.
18. Per person, residents in India and Indonesia consumed 18 8-ounce servings of soda in 2019.
(Statista)
This makes them the countries with the least soda consumption among the 10 most populated countries in the world.
From 2014 to 2016, a total of 1.25 billion Indian people drank 5.9 billion liters of soda per year. This makes the country’s consumption large, but it’s relatively lower than in countries like the United States, Kuwait, Thailand, the Philippines, and Malaysia.
19. The United States ranked second place among countries with the most soda consumption in 2019.
(Statista)
That year, the United States was only second to Mexico when it comes to most soda consumption, with a per capita consumption of 618 8-ounce servings. Next in line was Brazil, with a consumption of 280 8-ounce servings per capita.
In 2021, however, America’s soda consumption increased to 776 8-ounce servings per capita.
20. Just one soda a day can lead to weight gain, an average of 28 pounds a year.
(City Smiles St. Louis)
If you’re used to drinking a soda every day, it may not seem like much but you might be shocked to know that this habit could lead to weight gain.
One study found that just drinking one soda a day could lead to a pound of weight gain in about 13 days, which adds up to about 28 pounds of weight gain per year.
Sodas have a lot of sugar in them—which is great for providing you with quick energy, but that’s all it does for you. It doesn’t give you any nutrients or help you stay hydrated—and if you drink it often, it can add up and lead to weight gain.
As we all know, weight gain can lead to serious health problems and other issues down the road, from decreased mobility to heart disease, diabetes, etc.
Now that you know how much your body is affected by just one soda a day, maybe you’ll rethink your drink order next time!
Related Questions
What percentage of the population drinks soda?
According to a poll conducted by Gallup, nearly half of the US population drinks at least one glass of soda each day. That’s approximately 48% of Americans versus 52% who say that they don’t normally drink soda. What’s more, the average soda drinker drinks 2.6 glasses of soda per day. Meanwhile, 28% report drinking only an average of one glass per day, and 20% say they drink two or more glasses.
Who consumes the most soda?
In 2019, the country with the highest soda consumption was Mexico, consuming a little over 630 8-ounce servings of soda per capita per year. That’s just in one country. After Mexico, the United States comes next, with a soda consumption of 618 8-ounce servings per capita per year. Brazil came in third place, and their soda consumption was only less than half of what Mexicans drank that year.
What age group consumes the most soda?
While it’s nearly impossible to quantify which age group consumes the most soda, we can tell you which one has the highest percentage of soda drinkers. In a 2018 survey, 58% of respondents between the ages of 30 to 49 stated that they drink soft drinks regularly, making them the age group with the highest soda consumption in the United States.
How much soda is too much?
According to health experts, even one tiny glass of soda is too much. Unlike coffee, which can be beneficial when taken in moderation, soda has no health benefits at all. In fact, the sugary kind of soda contributes to a lot of health problems, such as diabetes, obesity, and cardiovascular issues.
Do people drink more diet or regular soda?
According to a Gallup survey of 2,027 American adults, more people drink regular soda regularly than diet soda. In particular, 32% of adults drink regular soda regularly, 24% prefer diet soda, while 43% don’t drink any kind of soda at all.
Although both types of soda share the same list of cons, diet soda is the lesser evil, so to speak. Regular consumption of regular sugary soda can cause weight gain, obesity, and a number of health complications that come with that. On the other hand, diet soda can help reduce the calories and avoid too much weight gain.
Conclusion
Wow, what a journey it’s been! The history of soda, who drinks it the most, how much of it we drink, and how those stats have changed over time.
We’ve learned that soda is consumed by everyone from children to the elderly, that people spend a lot of money on it, and that there are many health concerns surrounding it.
We hope you’ll take this information into consideration next time you go to grab a can of cola. And if you’re inspired to make a change in your life as a result of reading this blog post, we’d love to hear about it!
Did any stats surprise you? Did we miss any stats or facts that you wanted to see? Let us know!
34 Sparkling Water Statistics That Will Make You Salivate
16 Bubble Tea Statistics to Calm Your Cravings